
The bitcoin price usd chart has not looked this fragile since the depths of the 2022 collapse. After hitting a bitcoin all time high above $126,000 in October 2025, BTC has surrendered nearly half its value in four months, dropping below $70,000 for the first time in over a year. Exchange order books are 40% thinner than pre-crash levels, leveraged positions worth billions have been forcibly closed, and institutional ETF holders are sitting on an estimated $7 billion in paper losses.
If you have been asking why is bitcoin crashing with such ferocity, the answer lies in a collision of on-chain deterioration, macroeconomic headwinds, and a mining sector operating deep in the red. This bitcoin price usd analysis digs into the data behind every major support zone, the blockchain technology that keeps the network alive even during extreme stress, and the on-chain signals that will determine whether BTC stabilizes or extends toward much lower levels.
Current Bitcoin Price in USD: Where We Stand in February 2026
The btc price today sits near $69,500 after a violent rebound from a $60,000 flash low on February 6. That single-day 15% plunge triggered over $2 billion in crypto liquidations and marked BTC’s worst weekly performance since the FTX collapse. Despite the bounce, the broader structure remains bearish. CryptoQuant’s head of research has declared BTC in a bear market that could extend through Q3 2026, while Stifel’s chief equity strategist has published a btc price prediction projecting a potential bottom near $38,000 based on trendlines connecting the lows of every major crash since 2010.
The bitcoin market cap has contracted from roughly $2.5 trillion at the peak to approximately $1.38 trillion today. U.S. consumer crypto adoption has fallen from 17% in mid-2025 to around 12%, according to Deutsche Bank, signaling that retail interest is fading alongside institutional conviction. Every bitcoin price forecast carries uncertainty, but current data points lean heavily toward continued downside risk before any durable recovery.
Key Reasons Behind the Ongoing Bitcoin Crash 2026
1. On-Chain Signals Flashing Red
On-chain data provides some of the most reliable insight into where the bitcoin price usd might head next. BTC broke below its bitcoin 365 day moving average for the first time since March 2022, and the decline since that breakdown has been steeper than the early 2022 bear phase. The MVRV Z-Score, a metric that compares market value to realized value and historically identifies cycle tops and bottoms, recently dropped to 0.545, well below the overheated readings above 3.7 seen at the October peak.
Realized price, the average cost basis of all BTC based on when coins last moved on-chain, sits near $55,325. Historically, sustained bull markets require the spot price to trade above this level. BTC has not broken below it yet, but the gap is narrowing fast. Around 44% of the total supply now sits in unrealized loss, up from just 22% at the peak. This shift means that nearly half of all holders face psychological pressure to sell, creating a persistent supply overhang that caps every rally attempt.
Whale behavior shows a clear split. Long-term holders with coins acquired before the bull run remain largely inactive. However, newer whales who accumulated over the past five months at average prices near the high $90,000s are actively selling into bounces. This pattern of distribution rather than accumulation is a hallmark of bear market structure.
2. Macro and Regulatory Pressures
Bitcoin has increasingly traded as a high-beta risk asset, moving in lockstep with the Nasdaq 100 rather than acting as a hedge against inflation. Disappointing tech earnings, rising credit stress in the technology sector, and hawkish Federal Reserve policy have driven capital toward traditional safe havens like gold and silver, away from speculative instruments. The Crypto Fear and Greed Index has plunged to around 15, firmly in “extreme fear” territory.
Bitcoin institutional selling has compounded the damage. U.S. spot exchange-traded funds, which purchased 46,000 BTC during the same period last year, have become net sellers in 2026. Bitcoin etf outflows have exceeded $6 billion over the past three months, with the longest streak of losses since these products launched in January 2024. The nomination of Kevin Warsh as the next Federal Reserve chair introduces additional uncertainty around monetary policy, keeping the bitcoin price usd vulnerable to macro shocks.
3. Leveraged Trading and Liquidation Cascades
Derivatives markets have amplified every downward move. Over $3.5 billion in leveraged positions were liquidated when BTC broke below $70,000 in early February. Each wave of bitcoin liquidation creates a cascading effect where forced selling triggers lower prices, which hits more stop-losses and margin calls, which forces more selling. The Bitcoin Taker Buy Ratio, a metric tracking whether buyers or sellers are more aggressive, dropped to 0.48, its lowest reading since October 2025, confirming that selling pressure is dominating.
A confirmed bitcoin head and shoulders pattern on the weekly chart, with the neckline broken near $78,000, projects a measured move target around $50,000. Technical analysts note that deeper extensions toward the $38,000 to $40,000 range become plausible if institutional outflows persist and macro conditions do not improve.
The Technology Behind Bitcoin and Why It Still Matters
How the Bitcoin Blockchain Processes and Validates Transactions
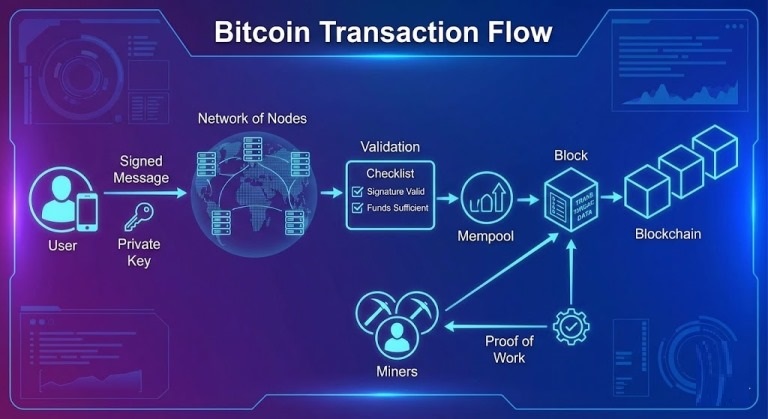
Every btc to usd transaction begins when a user signs a digital message with their private key and broadcasts it to a global network of approximately 20,000 nodes. These nodes independently verify that the sender holds sufficient funds and that the transaction conforms to protocol rules, all without relying on any central authority.
Valid transactions are grouped into blocks, each roughly one megabyte in size, and appended to the blockchain approximately every ten minutes through a process called Proof of Work. The blockchain itself is a distributed ledger, an immutable chain of records accessible to anyone. This transparency means on-chain analysts can track coin movements in real time, identifying accumulation patterns, exchange flows, and wallet behavior that traditional markets cannot offer.
During periods of panic selling, network congestion surges. When too many users rush to move BTC simultaneously, transaction fees spike and confirmation times lengthen. This bottleneck can intensify selling pressure because traders unable to move coins fast enough may accept lower prices to exit. In early February 2026, daily transaction volumes exceeded $75 billion as holders repositioned during the crash, demonstrating both the network’s resilience and its limitations during extreme stress events.
Also Read: Fintechzoom.com Bitcoin Delivers Unmatched Accuracy and Insights
Mining Economics, Hash Rate, and the ,000 Problem
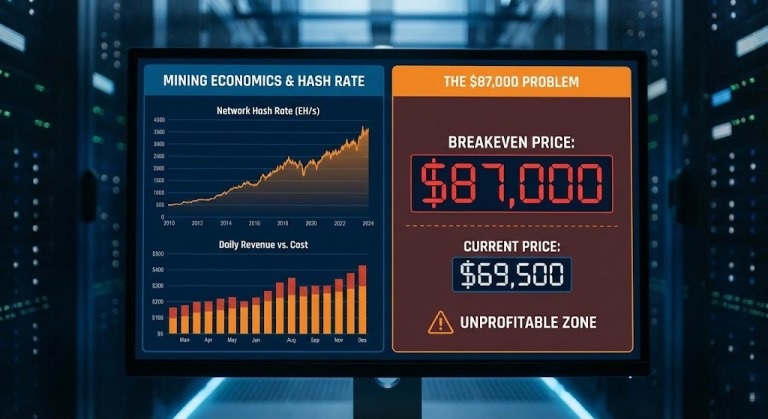
Bitcoin miners secure the network by deploying specialized ASIC hardware to solve computational puzzles that validate new blocks. The total computing power committed to this process, measured as hash rate, peaked near 1.1 zettahash per second in October 2025 before declining roughly 20% as unprofitable operations shut down.
Here is where the technology directly connects to bitcoin price usd risk. The average cost to mine one BTC is approximately $87,000 according to Checkonchain data, while the spot price trades near $69,500. That means miners are losing money on every coin they produce. Hash ribbon indicators, which track the relationship between short-term and long-term hash rate averages, have flashed a capitulation signal for the first time since 2022.
Miners facing negative margins are forced to sell BTC reserves to cover electricity bills, service debt, and maintain operations. Publicly traded miners like Marathon Digital, Riot Platforms, and CleanSpark hold massive BTC positions acquired during the bull run. If prices drop another 10% to 15%, analysts warn that forced selling from these corporate treasuries could create a self-reinforcing downward spiral. In previous bear markets, including 2019 and 2022, BTC traded below production cost before eventually converging back toward it, but the pain lasted months, not days.
How Trading Infrastructure Accelerates Price Moves
Modern crypto markets operate through a complex web of exchanges, API-connected trading bots, high-frequency market makers, and derivatives platforms offering up to 100x leverage. When order book depth thins out, as it has by approximately 40% during the current drawdown, automated strategies can push prices through key bitcoin support levels far faster than organic selling alone.
The interaction between spot markets and derivatives creates feedback loops. When futures funding rates turn negative, short sellers pay long holders, incentivizing more short positions. When open interest collapses through liquidation cascades, the resulting spot selling overwhelms thin order books. This infrastructure-driven amplification explains why BTC moved from $78,000 to $60,000 in barely 48 hours, a move that would have been mechanically impossible in earlier market cycles with less leverage and simpler trading technology.
Risk Management for Investors Watching Critical Support Zones
If the question should i sell my bitcoin keeps crossing your mind during this bitcoin bear market, that emotion itself is a signal to slow down rather than act impulsively. Bear markets reward discipline, not panic.
Diversification across uncorrelated asset classes reduces exposure to any single drawdown. Position sizing, where no single investment represents a catastrophic percentage of your portfolio, protects against tail risks. Stop-loss orders at predefined levels can limit downside without requiring constant chart-watching. Dollar-cost averaging, the practice of investing fixed amounts at regular intervals regardless of price, has historically smoothed out the violent swings that define a crypto winter.
Asking is bitcoin a good investment during a period of extreme fear depends entirely on your time horizon, risk tolerance, and financial circumstances. The technology underpinning the network, its fixed 21-million-coin supply, decentralized security model, and growing institutional infrastructure, remains fundamentally unchanged by short-term price action. But understanding the technology does not eliminate market risk.
The writing here is strictly for learning plus reference intent. No fiscal guidance offered. Do perform individual investigations and seek out a certified fiscal specialist prior to concluding on asset deals.
Conclusion
The bitcoin price usd faces a convergence of bearish signals that make further downside a realistic scenario. On-chain metrics show weakening demand, persistent distribution by large holders, and an MVRV Z-Score well below levels associated with sustained recovery. Miners are operating 20% below production cost, ETFs are bleeding capital, and leveraged positioning continues to amplify every move.
Every credible bitcoin price prediction 2026 acknowledges uncertainty. Stifel’s $38,000 trendline target, Compass Point’s $60,000 to $68,000 base case, and Bernstein’s expectation of a recovery in the second half of 2026 all share one common thread: the path forward depends on whether institutional flows stabilize, macro conditions improve, and miner capitulation runs its course.
What does not change is the technology. Bitcoin’s blockchain continues to process and settle transactions across a global, decentralized network secured by nearly a zettahash of computing power. That infrastructure has survived every previous bitcoin price drop today, yesterday, and throughout its 17-year history. Whether the current cycle follows the same recovery script depends on variables no single analyst can predict with certainty. Stay data-driven, manage risk deliberately, and make decisions based on evidence rather than headlines.
FAQs
What does it mean when traders talk about a Bitcoin support level at 40K?
A support level is a price zone where historical buying activity has been strong enough to halt further declines. The $40,000 area aligns with Stifel’s trendline connecting previous cycle lows and sits near the production cost floor for older-generation mining hardware, making it a zone where significant demand could emerge.
Can Bitcoin’s underlying technology prevent price crashes?
No. The blockchain ensures transaction security, transparency, and decentralization, but it does not control market sentiment, leverage, or macroeconomic forces. Technology provides long-term structural value, while short-term prices are driven entirely by supply, demand, and liquidity conditions.
How does the Bitcoin hash rate relate to the BTC price in USD?
Hash rate reflects total mining computing power and indicates network security and miner confidence. When BTC trades below mining production cost, as it does now at $69,500 versus an $87,000 average cost, miners shut down or sell reserves. This selling pressure pushes prices lower, while hash rate declines signal weakening miner participation.
Is a drop to 40K guaranteed if bitcoin market volatility increases?
Absolutely not. The $40,000 scenario requires a specific combination of sustained ETF outflows, accelerating miner capitulation, macro deterioration, and cascading leverage liquidations occurring simultaneously. Prices could stabilize, consolidate, or recover if any of these variables improve.
What should new investors consider before reacting to a Bitcoin price USD alert?
Avoid impulsive decisions driven by fear or short-term headlines. Define your risk tolerance before entering any position. Use dollar-cost averaging to reduce timing risk. Verify claims from multiple credible, data-backed sources rather than relying on social media predictions. And remember that bear markets, while painful, have historically been followed by recoveries that set new all-time highs.