
Road safety continues to be a critical concern worldwide. Human error, especially driver behavior, contributes to most serious accidents, whether via distraction, fatigue, aggression, or descrased attention. To counter this, modern systems are turning to driver behavior analysis with AI— using machine learning and sensing technologies to identify risky driving, give feedback, and ultimately reduce crashes and injuries.
Modern road safety systems rely on understanding not just vehicles, but the people behind the wheel. Today’s advanced driver behavior analysis with AI combines visual recognition, motion tracking, and contextual data to predict risks before they happen. In practice, this often involves training models on diverse visual sources — traffic footage, telemetry, and even car plates data that help synchronize vehicle identity with behavioral patterns in real-world scenarios.
In this article, we’ll walk through how such systems work, what challenges they face, and how they’re already reshaping transportation safety.
- Why Focus on Driver Behavior?
- Key Components of Driver Behavior Analysis
- Comparison of Machine Learning Methods
- Visualization: Risk Behavior Trends Over Time
- Challenges & Open Issues
- Conclusion
Why Focus on Driver Behavior?
Before vehicles malfunction or the road degrades, many accidents result from how a person drives. Aggressive acceleration, hard braking, sudden lane changes, drowsiness, or distracted driving each raises risk. Traditional accident prevention systems (ABS, ESC, etc.) act as safeguards. But understanding why a crash might occur—and earlier—is where behavior analysis shines.
- Distraction and misuse of partially automated driving systems have become more visible concerns. A 2024 study from the Insurance Institute for Highway Safety found that drivers using partial ADAS (like lane-keeping, pilot assist) are more likely to engage in distracting behavior (phones, etc.) than expected.
- Fuel consumption and emissions are strongly affected by driving style: aggressive acceleration, braking, and speed variability. Based on research, a study using drive cycle simulations showed aggressive driving can increase fuel consumption by 23%.

Key Components of Driver Behavior Analysis
Here’s a high-level pipeline for driver behavior analysis with AI:
- Data collection
- Feature extraction / preprocessing
- Behavior detection / classification
- Feedback & intervention
- Model refinement and continuous learning
Let’s unpack each step.
Data Collection
Data comes from several sources:
- Vehicle sensors / CAN bus: speed, throttle position, brake pressure, steering angle, yaw rate, lateral acceleration, etc.
- Camera / computer vision: face-facing and outward cameras can detect gaze direction, head pose, eye closure, lane keeping, and traffic scene context.
- Physiological sensors: advanced research settings may use heart rate, EEG, eye tracking, and galvanic skin response to sense fatigue or stress. Because cameras and sensors involve personal data, privacy, latency, and robustness are critical design constraints.
Feature Extraction & Preprocessing
Raw sensor streams (e.g., acceleration over time) are noisy and high-dimensional. We typically:
- Clean and align timestamps
- Smooth signals (filtering)
- Derive features such as jerk (rate of change of acceleration), time headway, steering volatility, etc.
- Compute aggregates or windows (e.g., average speed over 5s, number of harsh braking events per minute)
- Contextualize with road & traffic conditions (urban vs highway, weather, time of day)
These features become the input vectors for the next stage.
Behavior Detection / Classification
Here is where machine learning models operate. There are a few common strategies:
- Supervised classification: labeling data into classes (normal, aggressive, distracted, fatigued) using algorithms like Random Forests, SVM, neural networks, or hybrid models.
- Sequence models / time-series: using recurrent neural nets (RNNs, LSTM) to capture temporal context.
- Unsupervised / anomaly detection: models are trained on “normal” driving only; deviations are flagged as anomalous/aggressive. A paper on unsupervised profiling used RNN reconstruction error in this way.
- Graph-based techniques: modeling interactions among multiple vehicles or feature transitions, then classifying via spectral graph methods. For example, GraphRQI uses the eigen-spectrum of a driving-interaction graph.
Feedback & Intervention
Once the system detects unsafe behavior or a risky trend, it must act:
- Real-time alerts: audible or haptic (vibration) feedback to the driver
- Post-trip scoring & reports: dashboards or mobile apps that present “driving style scores” with visualizations
- Gamification / coaching: some fleets tie incentives to improved driving metrics
Effective feedback must avoid being annoying or distracting. Human factors are as important as algorithmic accuracy.
Model Refinement & Learning
Driver behavior evolves, conditions change, and sensors drift. So:
- Use online learning or periodic retraining
- Incorporate user feedback and labeling
- Deal with imbalanced classes (accident events are rare) by oversampling, synthetic data, or weighted loss
- Validate on new drivers, vehicles, and geographic domains via transfer learning to avoid overfitting to one fleet.
Also Read: AI-Powered Corporate Learning: The 2025 Training Tech
Comparison of Machine Learning Methods
| Type of Method | Strengths | Weaknesses | Best Use Cases |
| Supervised classification (neural nets, random forests, etc.) | High accuracy when large labeled datasets exist; well-understood outcomes | Data labeling cost; often overfits; poor for rare events | Fleet-wide safety systems; usage-based insurance; behavior scoring |
| Semi-supervised / anomaly detection | Use less labeled data; good at detecting unusual or rare behavior | Often more false positives; detecting “novel” unsafe behavior is tricky;it requires good thresholds | Real-time risk detection; monitoring new drivers; safety critical event detection |
| Personalized models (cognitive factor inference, etc.) | Better user acceptance; adapts to driver style; less annoyance | Need sufficient driver-specific data; complicates system design; possibly more privacy exposure | Adaptive warnings; behavior modification; human-machine co-driving |
| Context-aware models | More accurate by incorporating road type, traffic, environment, etc. | Need rich sensor and external data; harder to deploy in all regions; possibly more latency | Systems that operate across varied terrains/locations; mixed traffic; autonomous / ADAS settings |
Visualization: Risk Behavior Trends Over Time
Here’s a stylized graph illustrating how a driver’s “risk score” might evolve during a trip:
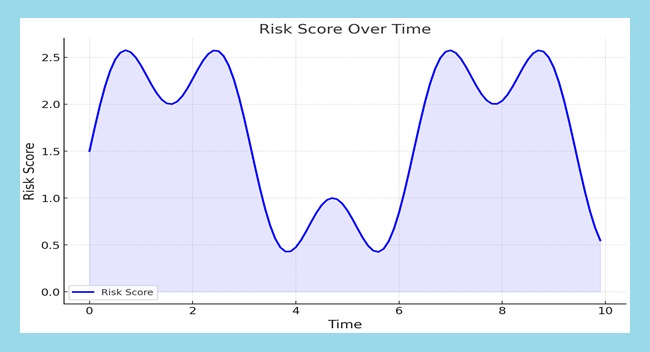
● The risk starts low, but spikes during sharp braking, abrupt maneuvers, or drowsiness
● A system might flag those peaks and prompt review or real-time alerting
In practice, shading, trend lines, and event markers enhance readability. Many fleet dashboards provide weekly or monthly driver risk overlays.
* The data used in this visualization is synthetic and created purely for illustrative purposes. It does not represent actual driver data but rather mimics what real driver behavior analysis systems might output. In practice, such risk scores are calculated using real telemetry — from vehicle sensors (CAN bus data), cameras, and contextual information (speed, acceleration, lane position, etc.) — then modeled through AI-driven behavior detection systems.
Challenges & Open Issues
Despite progress, several challenges persist:
- Data privacy and ethics
Camera and physiological sensors may raise privacy concerns. Regulations like GDPR demand careful anonymization and user consent. - Domain shift & generalizability
Models trained in one vehicle type, region, or driver cohort may not generalize well. Transfer learning and continual adaptation are essential. - Rare event detection
Critical events (crashes, near-misses) are infrequent. Without enough positive examples, models may struggle. Synthetic data, oversampling, or anomaly detection approaches can help mitigate this. - Alert fatigue
Too many false or marginal alerts may lead users to ignore warnings. Balancing sensitivity and user trust is vital. - Real-time constraints
Low-latency, resource-efficient models are needed to run onboard (edge computing) rather than in the cloud only. - Explainability and trust
For adoption in safety-critical systems, models must provide an interpretable rationale (e.g., “hard brake + deviation in lane”). - Integrating external context
Road conditions, traffic density, weather, and lighting—all influence safe behavior. Context-aware modeling is necessary for fairness.
The literature continues to explore solutions, such as hybrid systems combining rule-based and ML methods, lightweight architectures, and human-in-the-loop adaptation.
Conclusion
Analyzing driver behavior with AI is no longer a futuristic concept—it’s becoming a concrete lever for reducing accidents, lowering costs, and improving mobility systems. By combining sensor fusion, machine learning, feedback loops, and human-centric design, these systems detect risky patterns before they lead to incidents.
While technical, legal, and adoption challenges remain, the trajectory is clear: smarter behavior analysis will be central to the next generation of safe, intelligent transportation.